Created by the Boston Consulting Group, the Growth Share Matrix provides a framework for analyzing products based on growth and market share. It is also commonly called BCG matrix. The Growth Share Matrix has been used since 1968 to help companies better understand which products best help them exploit market share growth opportunities. It is actually used to identify growth opportunities and help entrepreneurs make investment decisions based on their positions.
How to read a Growth Share Matrix
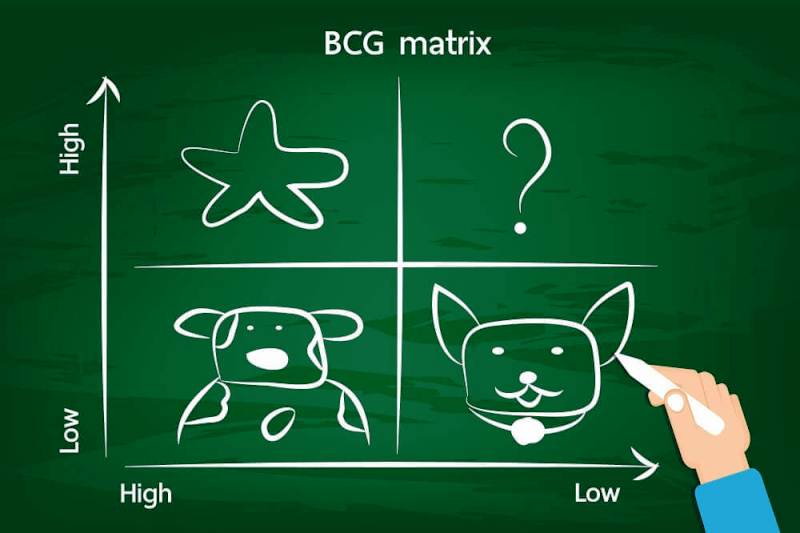
The matrix is represented by two components:
– Market growth
– Market share
There are then 4 representations:
– The star
– The cash cow
– Question mark
– The dog
The star represents stars with high market share and high growth. Products in this category need to maintain significant investments to remain leaders. In the world of civilian leisure drones, we could cite the brand: DJI with its “Phantom” drones, the drone market is developing strongly and Phantom drones are the leader, being number 1. It is therefore necessary for the brand to make large investments to increase the production of its product and follow its evolution to remain the Star of the market.
Star status is difficult to maintain given the competition and market fluctuations.
The cash cow concerns products that have a very large market share within a low-growth market.
The market is limited, but generates significant cash, the cash can be used for another product or to increase the market share of a product that has a small share of a rapidly growing market.
The dog, also called the follower or deadweight, concerns products in a low-growth market with a low market share.
Without growth in the market and with a small share in it, it will be interesting and you will have to leave this market.
The question mark or dilemma indicates that the market is growing strongly, but you have a very small share of it. You will have to make substantial investments to gain market share.
Create your Growth Share Matrix
To build your matrix, you will need to collect information and data on your market and identify the characteristics of your products within your market and your sector of activity. A comprehensive market study will show your market share and the growth rate of each of your products or services.
Also analyze the growth of this market and enter into an objective comparison process with your main competitors. Growth is an evolution over time, so it is necessary to follow the market over a sufficiently broad period such as 2 or 3 years.
In the four-quadrant chart, you will place competing products as you go and always in relation to each other.
Apply the Growth Share Matrix for your strategies
In a perfect world, you should have products in each of the quadrants to maintain good cash flow and have products that can secure your future. If your product is a cash cow, it normally requires little investment and generates a lot of cash, however, the growth is amorphous and you must therefore try to reduce your investments to use this cash to invest it in products that have growth opportunities.
Using the cash from your cash cows to invest in your products requiring investment is a good way to create a virtuous circle. Becoming a star should be your goal, if you only have a very small market share, the use of cash from other categorized cash cow products could create a virtuous circle and develop your income. After all, cash flow is at the heart of the Growth Share Matrix and investing in your assets should allow you to remain a star and keep pace with market growth. If you want better results, combining with Ishikawa Diagram is recommended.